If you're posting on X and asking whether any of it is turning into calls, messages, bookings, or tours, analytics for twitter is how you get a real answer. The useful part isn't the dashboard itself. It's using the data to see which posts attract local buyers, which clicks become leads, and which conversations help your reputation in [City] or [Neighborhood].
Introduction Why Twitter Analytics Matter for Your Business
A roofing company runs a storm-response post on X. It gets replies, a few reposts, and more profile visits than usual. By the end of the week, the owner still cannot answer the only question that matters. Did that post produce estimate requests, branded Google searches, new reviews, or booked jobs?
That gap is why analytics for twitter matters for a local business.
Used properly, it connects activity on X to real business signals. You can see which posts send people to a service page, which ones trigger direct messages, and which topics create the kind of brand familiarity that later improves click-through on your Google Business Profile. For service businesses trying to tie social activity into a wider digital marketing plan for local businesses, that connection is what makes the platform worth tracking in the first place.
If you need a plain-language primer before going deeper, this walkthrough on Twitter analytics explained is a useful starting point.
Key Facts
- Engagement rate matters because it shows whether visibility turned into actions such as clicks, replies, profile visits, or shares.
- For local businesses, the best use of Twitter data is tying posts to site visits, review generation, Google Business Profile performance, and lead handling, not just measuring content popularity.
- Google uses relevance, distance, and prominence to rank local results, according to Google's guidance on how local ranking works. Social activity does not replace local SEO work, but stronger brand awareness and more customer touchpoints can support the signals behind prominence and branded demand.
- A post with modest reach can still outperform a high-visibility post if it produces a phone call, form submission, direction request, or a review request that turns into public proof.
- Good reporting separates attention from revenue impact. That distinction keeps teams from spending time on content that looks active but does little for sales.
Practical rule: Put every Twitter metric in one of two buckets. Revenue path or noise. If it does not help you improve calls, bookings, messages, walk-ins, or reputation, it belongs lower on the report.
Understanding Native Twitter Analytics
A plumber posts about burst pipe repair during a cold snap. The tweet gets plenty of views, but the useful question is simpler. Did it lead to profile visits, link clicks, calls, or branded searches that turned into jobs? Native Twitter analytics gives you the first layer of that answer fast.
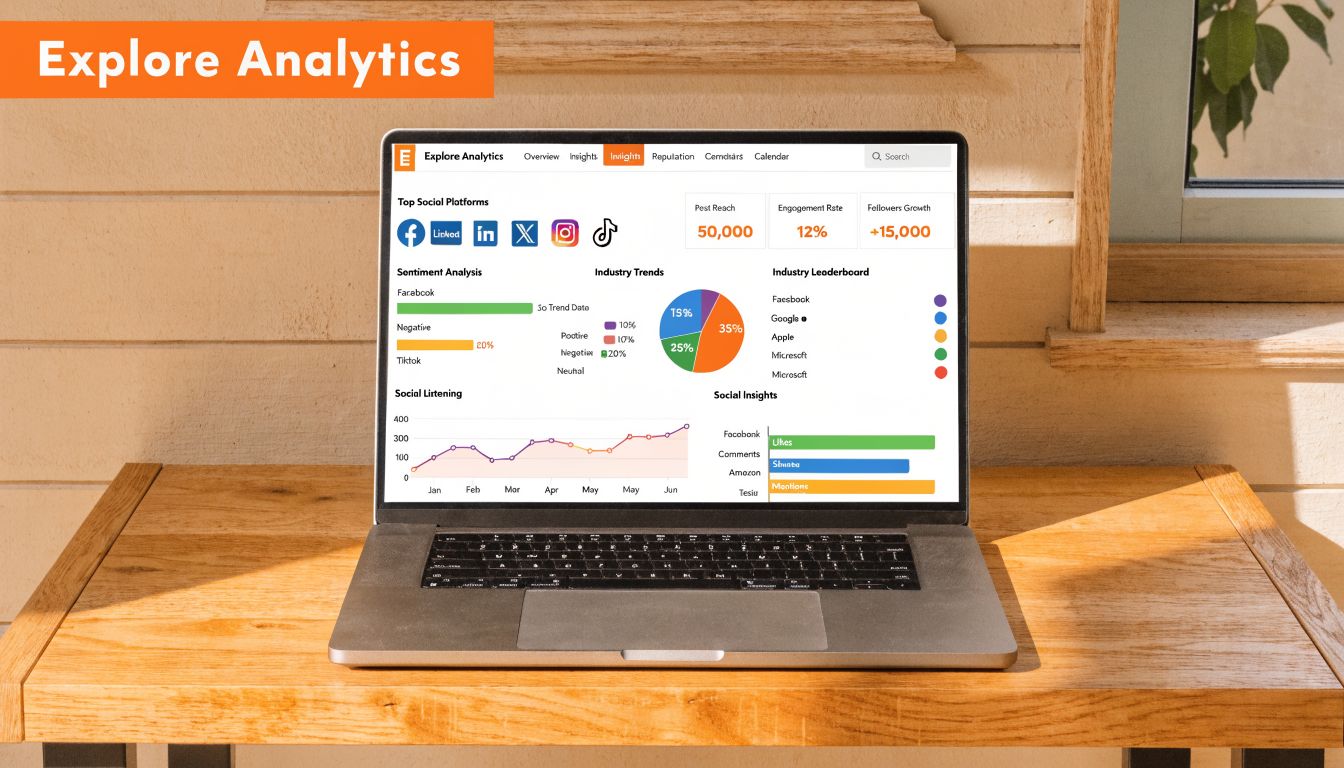
Start there because it shows what happened on the platform before you bring in call tracking, CRM data, or Google Business Profile performance. The dashboard groups your account activity into a few practical buckets: how often posts were seen, what actions they earned, and who interacted with them. If you need a clearer definition of visibility, this guide on what impressions on Twitter mean helps separate exposure from actual interest.
The metrics that matter first
Impressions show how often a post appeared in feeds. Useful, but only as a starting point. High impressions on a tweet about a seasonal offer can mean broad visibility. They do not tell you whether anyone cared enough to visit your profile, click to your site, search your brand on Google, or leave a review after service.
Engagement rate gives a better read on whether the post earned action. Native analytics calculates it from total engagements against impressions. For a local business, I use it as a quick quality check before looking deeper. If impressions rise and engagement rate falls, reach may be getting broader while buyer relevance gets weaker.
Link clicks matter when the post points to a booking page, financing page, menu, coupon, or location page. Often, local operators miss the true trade-off. A funny tweet can attract likes. A plain tweet with a strong offer and a clean call to action can send people to the page that produces the sale.
Profile visits often show commercial curiosity. People use your profile to verify legitimacy, location, hours, and recent activity before they take the next step. If profile visits rise after testimonial posts or service-result photos, check whether branded search, Google Business Profile views, or direct calls rise too.
How local operators should read the dashboard
The same metric means different things depending on the business model.
For an HVAC company, a spike in impressions on an emergency repair tweet only matters if it also produces profile visits, replies asking about availability, clicks to the service page, or a lift in after-hours calls. If none of those move, the post created attention without demand.
For a restaurant, impressions on a limited-time menu post can still be useful with lower click volume, but only if they create enough curiosity to drive map searches, direct messages, reservations, or same-day walk-ins. In that case, the post is doing awareness work that supports an offline visit.
That is the local lens. Read each metric against the action your customer usually takes next.
Native analytics also helps you compare tweet formats, review post-level performance over time, and spot whether your audience lines up with the cities and interests you serve. For a single-location business, that can expose wasted attention fast. If a large share of engagement comes from outside your service area, content may be attracting the wrong crowd even when top-line numbers look healthy.
A simple weekly review works well:
- Check account trends first to see whether overall visibility and engagement are rising or slipping.
- Review your top posts by business intent and separate informational posts from offer-driven posts.
- Look for audience fit by checking whether engagement appears to come from the locations and interests you want.
- Record action metrics such as link clicks, profile visits, replies, mentions, and direct messages.
- Match spikes against business signals like Google Business Profile searches, direction requests, review requests sent, and booked leads.
Later in your review cycle, it helps to watch a quick visual breakdown like this before you export data and build your own report.
What native analytics does well and where it falls short
Native analytics is strong for short-cycle feedback. You can quickly see whether a same-day dental emergency post drew interest, whether a med spa promotion pushed profile visits, or whether a seasonal car care reminder generated replies.
Its weak spot is attribution across multiple steps. A person can see a tweet, search your business later, read reviews on your Google Business Profile, and book two days after that. Native analytics will not connect that full path for you. That is why the best setup pairs platform data with tagged links, call tracking, booking records, and a review process that shows whether social traffic leads to public proof and closed revenue.
Native analytics shows platform response. Your CRM, booking system, and review workflow show whether that response turned into sales.
Key Performance Indicators for Local Businesses
A local owner does not need a social dashboard packed with vanity metrics. They need a short list of indicators that show whether Twitter activity helped produce calls, bookings, walk-ins, review requests completed, or stronger branded search around the business.
That changes how KPIs should be prioritized. Impressions and follower growth still have a place, but they sit lower on the list because they rarely explain revenue by themselves. For service businesses, the better question is simple: what happened after someone engaged?
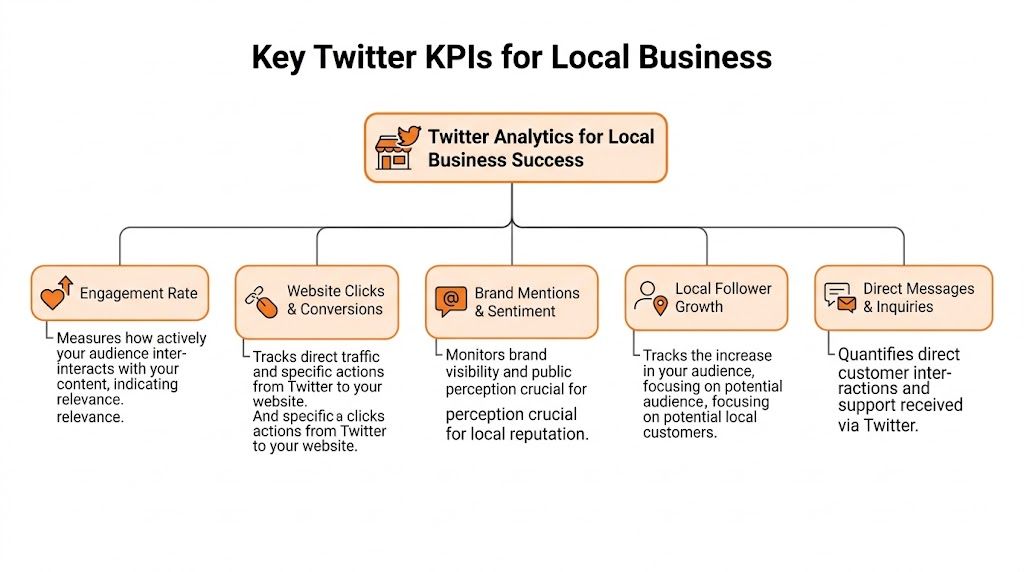
The most useful starting metric is engagement rate. It rolls multiple actions into one percentage, which makes it a practical first screen for content quality. Tweet Archivist’s glossary explains the calculation as (Total Engagements / Impressions) × 100, and it also defines the engagement actions included in that total, such as likes, reposts, replies, follows, profile clicks, hashtag clicks, and media views according to Tweet Archivist.
The KPI hierarchy that actually helps operators
For most local businesses, I sort Twitter KPIs into good, better, best because that mirrors how buyers move from awareness to action.
| Level | What to track | Why it matters |
|---|---|---|
| Good | Impressions, follower growth, media views | Confirms your posts are getting distribution |
| Better | Engagement rate, profile visits, mentions, replies | Shows that the message earned attention from real prospects |
| Best | Link clicks, direct messages, branded search lift, review requests completed, bookings from tagged links | Shows whether Twitter supported lead generation, reputation, and sales |
A common mistake is stopping at the "good" layer because it's easy to screenshot.
Operators need more than proof that a post was seen. They need to know which locations produced action, which offers led to inquiry, and whether Twitter traffic later showed up in Google Business Profile searches, review generation, or closed jobs in the CRM. That is the difference between social reporting and business reporting.
Why engagement rate stays near the top
Engagement rate is not the finish line. It is the first filter.
For local businesses, it works best as a diagnostic metric that helps decide what deserves more budget, more posting frequency, or a stronger call to action. If a tweet earns reach but weak engagement, the topic may have broad visibility without local buying intent. If engagement rises on posts tied to immediate problems, financing questions, seasonal reminders, or trust-building proof, that pattern usually deserves a closer look.
A few examples:
- Dental practice. Insurance explainers and before-and-after policy clarifications often outperform office updates because they reduce friction before a patient ever calls.
- HVAC company. Emergency repair posts may earn fewer impressions than maintenance content but produce more replies, clicks, and urgent visits to the booking page.
- Vet clinic. Educational threads can drive profile visits that later support branded search and appointment consideration.
- Auto repair shop. Safety posts that generate direct questions often assist the sale, even if the booking happens later by phone.
- Senior living community. Family-focused content usually matters more than amenity photos because the adult child is often part of the decision process.
Operational takeaway: High impressions with weak engagement usually mean the post reached people. It did not create enough interest to move them closer to a sale.
Use audience fit to judge whether engagement is actually useful
Raw engagement can hide a local targeting problem. A post can perform well on the platform and still do little for the business if the attention comes from outside the service area.
The practical check is location fit. If the people engaging with your tweets are concentrated in the cities, neighborhoods, or regions you serve, the account is more likely to support local revenue. If attention comes from outside your footprint, the content may be attracting the wrong crowd for a service business with fixed geography.
This matters even more for multi-location brands. I like using engagement per follower as a comparison metric across locations because it reduces the distortion caused by account size. A flagship office can post bigger totals and still perform worse than a smaller branch with better local relevance.
The KPIs that connect Twitter to local outcomes
The highest-value KPIs sit closest to the actions that create revenue and reputation.
- Link clicks show whether a tweet pushed someone to a service page, booking form, offer page, or location page.
- Direct messages and replies often capture high-intent questions, especially for urgent services.
- Profile visits can signal trust-building behavior before a search, call, or site visit.
- Branded search lift helps validate whether Twitter exposure increased later demand through Google.
- Review requests completed show whether social traffic entered your reputation funnel, which can improve Google Business Profile performance over time.
- Bookings from tagged links are the clearest proof that Twitter contributed to sales.
That last group is where local businesses usually get real value. A tweet that drives five review requests completed can matter more than one that earns a pile of likes, because new reviews strengthen local visibility and conversion across every channel, not just Twitter.
What works by vertical
Different service categories need different KPI weightings because customer behavior is different.
Med spa
Prioritize link clicks to treatment pages, consultation forms, and promotional landing pages. The post only matters if it helps create a consult.Dental and healthcare practices
Watch profile visits, link clicks, and direct inquiries. Keep public interactions privacy-aware and move sensitive conversations off-platform fast.Restaurants and hospitality
Track mentions, replies, and traffic to menus or reservation pages. Same-day intent shows up quickly in these businesses.Home services
Prioritize direct messages, replies, and visits to financing or booking pages. Urgent jobs often start with a short question and a fast response.Retail and franchise operators
Compare locations by engagement quality and action rate, not just follower count. A smaller store can produce more local demand if the content matches nearby customers.
One metric across every vertical produces weak reporting. The KPI mix should reflect how that business gets discovered, how trust is built, and what step usually happens right before the sale.
How to Build Your Twitter Analytics Report
A useful report should fit on one screen before anyone scrolls. If your monthly deck needs narration to make sense, it's too complicated.
The native dashboard already gives you a 28-day rhythm, which is enough for a disciplined monthly review. Export the data, keep the KPI count tight, and build a report that answers what changed, why it changed, and what your team should do next.
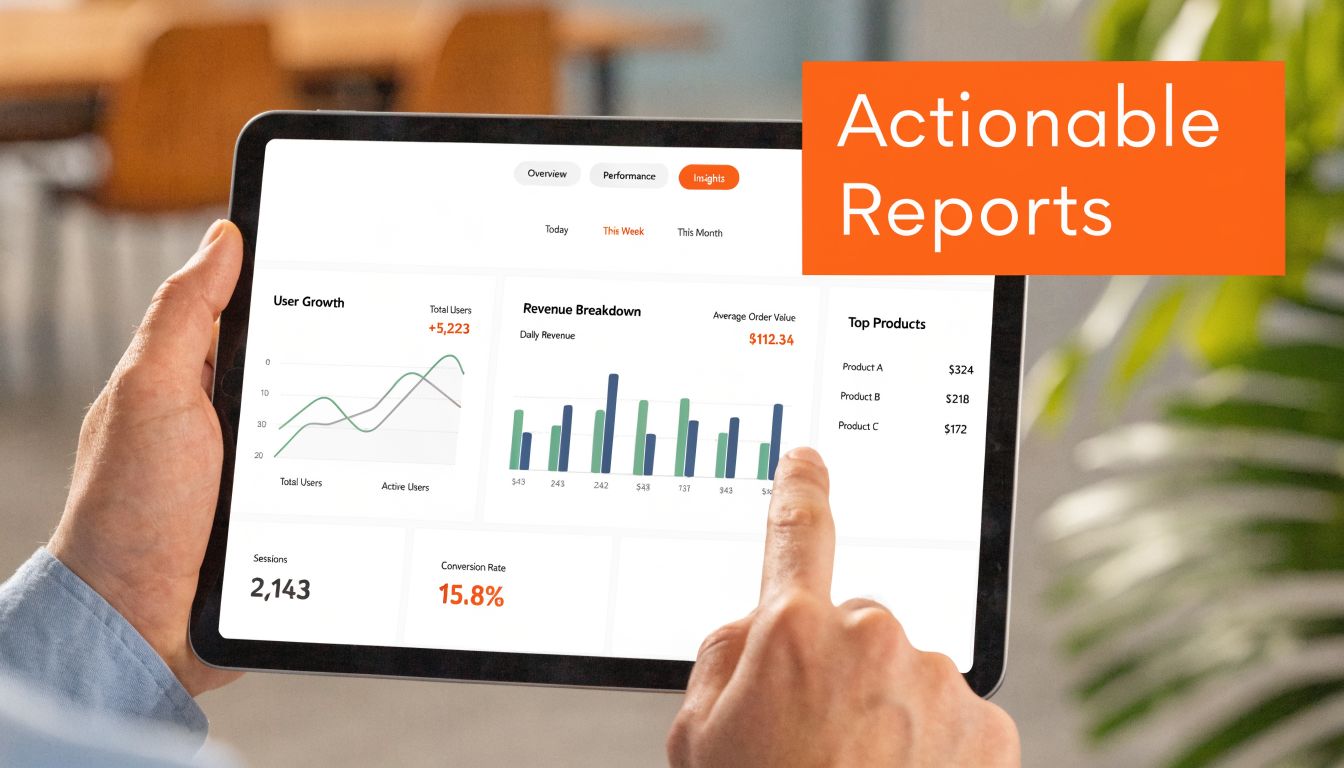
If you already produce local search dashboards, borrow that same discipline here. A clean local SEO reporting process usually translates well to social reporting because both need trend lines, exception spotting, and clear next actions.
The five-part report I recommend
Executive snapshot
Start with only the metrics leadership cares about: engagement rate trend, link clicks, profile visits, follower movement, and top-performing post themes.Top posts with a reason
Don't just list the best tweets. Add a short note explaining why each likely worked. Examples: strong local relevance, timely topic, clear call to action, useful image, or a format that fit the audience.Underperformers
Add a short section for tweets that got visibility but weak response. Analyzing these tweets helps content strategy improve.Audience and location fit
Note whether the account is attracting the right cities, interests, and customer types. For local brands, this matters more than raw growth.Business outcome notes
Summarize whether traffic from Twitter led to calls, forms, bookings, direct messages, or review requests.
What to include and how to visualize it
Use a mix of line charts, bar charts, and a short notes column. Keep each chart tied to a business question.
| Report element | Best format | Question it answers |
|---|---|---|
| Engagement rate over time | Line chart | Is content quality improving? |
| Link clicks by post | Bar chart | Which topics drove traffic? |
| Top posts by format | Simple table | What should we repeat? |
| Profile visits and mentions | Dual trend line | Is brand interest increasing? |
| Conversion notes from tagged links | Summary table | Did traffic turn into leads? |
The monthly review questions that matter
Use the same questions every month so your team can spot patterns instead of chasing noise.
- Which content format produced the strongest engagement quality?
- Which location themes got the most business-intent actions?
- Did any post generate profile visits without meaningful clicks?
- Are we attracting the audience we serve in [City] and nearby areas?
- Did Twitter support review generation, Google Business Profile traffic, or lead follow-up?
The report should end with decisions, not observations. "Post more videos" is incomplete. "Use more short service explainer videos tied to booking links for [City] emergency repair queries" is a decision.
A simple reporting template
Use this skeleton in Google Sheets, Looker Studio, or your BI tool:
- Headline summary
- 3 to 5 KPIs
- Top 5 tweets
- Bottom 5 tweets
- Audience fit note
- Traffic and conversion note
- Actions for next month
- Owner for each action
That last line matters. Reports fail when nobody owns the fix.
Connecting Twitter Data to Your Business Strategy
A common reporting failure is explaining what happened on Twitter, then leaving the owner to guess what changed in Google Business Profile performance, review volume, or closed revenue.
For a local service business, that gap is expensive. A tweet that earns clicks but sends people to the wrong page wastes intent. A post that builds trust but never feeds your follow-up process misses reviews. A campaign that drives visits without call tracking gives you activity, not evidence.
The job is to connect Twitter signals to business outcomes in a straight line:
post topic -> click or profile visit -> landing page action -> lead -> sale -> review -> stronger local visibility
That path matters more than raw engagement. I care less about whether a tweet got attention and more about whether it assisted a phone call, appointment request, estimate form, or branded Google search later that week.
Match Twitter metrics to local business outcomes
Twitter activity supports local growth in three practical ways.
First, it helps shape demand. Posts about real services, neighborhoods, seasonal issues, and common customer questions can send higher-intent visitors to the right page.
Second, it improves branded search behavior. If someone sees your business on Twitter, then later searches your name, clicks your Google Business Profile, and calls from there, Twitter still played a role even if the final click came through Google.
Third, it supports review generation after the sale. The tweet does not create the review by itself. It builds familiarity before the customer contacts you. That familiarity often makes follow-up emails, texts, and review requests more likely to get a response.
Use campaign tracking that reaches past the click
Native Twitter metrics show what happened on-platform. Business strategy needs post-click evidence too.
Every service offer, location page, and booking page linked from Twitter should use consistent UTM tags. Then pair that traffic data with call tracking, form submissions, CRM source fields, and sales outcomes. If you need a cleaner setup, this guide on tracking visitors to a website walks through the basics.
The practical test is simple. Can you answer these questions without guessing?
- Which tweet topics produced calls, not just clicks
- Which locations got traffic from Twitter but weak conversion rates
- Which service pages turned Twitter visits into booked jobs or appointments
- Whether Twitter-assisted visitors later returned through branded search or your Google Business Profile
- Which campaigns influenced both leads and review growth
If the answer is no, the reporting stack is incomplete.
Connect Twitter content to GBP performance
Twitter does not directly raise proximity in local search. It can support relevance and prominence by reinforcing what your business does, where you do it, and why people trust you.
That connection gets stronger when the same service themes appear across your tweets, service pages, and Google Business Profile. If an HVAC company keeps posting useful spring maintenance advice for homeowners in specific suburbs, but its landing pages and GBP categories are vague, the signal is diluted. If those assets line up, the traffic has somewhere useful to go, and the message is consistent.
This is why I usually recommend an integrated PR & social media strategy for businesses that want social activity to support local visibility instead of operating as a separate content stream. Consistent coverage, local mentions, and service-led social posts strengthen brand recognition across channels.
Focus on assisted value, not last-click credit
Twitter often works earlier in the buying cycle than search. A homeowner may see a storm-prep post on Tuesday, search your company name on Thursday, and book on Friday through Google Business Profile. If you only give credit to the last click, Twitter looks weaker than it otherwise is.
That does not mean every tweet deserves credit. It means your team should look for patterns across channels. If posts about financing, emergency service, or before-and-after job photos line up with lifts in branded search, profile views, calls, or review requests completed after the job, keep investing there. If humorous posts get engagement but do nothing for leads, treat them as low priority.
Build strategy around decisions
Good Twitter reporting should lead to operational choices.
If technician explainer videos drive more qualified traffic than company news, produce more of them. If one location gets strong Twitter traffic but weak close rates, check the landing page, phone handling, and offer. If review growth improves after campaigns that feature real staff and customer education, connect those themes to your post-service follow-up.
That is the connection between Twitter data and business strategy. You are not measuring social for its own sake. You are using Twitter evidence to improve calls, bookings, sales, review generation, and Google Business Profile performance.
Real World Examples and Performance Benchmarks
A local owner looks at Twitter and sees likes, reposts, and a few comments. What matters is whether those posts lead to more branded searches, more Google Business Profile actions, more review requests completed, and more booked work. Benchmarks help only if they give you a standard for making those calls.
A practical baseline from Tweet Archivist's Twitter analytics best practices is that healthy accounts often land in a modest engagement range, and strong posts usually earn most of their interaction early. For a local business, that matters less as a vanity target and more as a filter. If a post gets decent engagement but no profile visits, site clicks, review traffic, or appointment interest, it probably entertained people without helping the business.
Example one with a dental practice
A dental practice in [City] posts two content types for 60 days. The first covers office news, holiday hours, and staff updates. The second answers patient questions about insurance, urgent visits, teeth whitening, and what happens during a first appointment.
The office news posts support familiarity. The question-based posts usually do more useful work. They attract higher-intent clicks, send more people to service pages, and often line up with lifts in branded search and Google Business Profile views because patients now know what to search for. If the practice also uses a review request link on the landing page or in post-visit follow-up, those educational posts can support review generation indirectly by bringing in better-fit patients who are easier to convert and easier to ask for feedback.
That is a better benchmark than raw engagement. Compare content by downstream value.
Example two with HVAC and multi-location comparison
A regional HVAC company often learns fast that one message does not work in every suburb. Emergency repair content may perform best in one location, while maintenance savings and seasonal tune-up reminders pull better response in another.
The useful comparison is not just impressions against impressions. Compare each branch on four points: post engagement quality, clicks to the local landing page, calls or form fills from tagged traffic, and close rate after the lead comes in. If one location gets traffic from Twitter but sales stay weak, the problem may be the offer, the page, or the phone handling, not the post itself. Posting time can also change results, so it helps to test against a proven schedule and a practical guide to the best times and days for social media posts.
A branch that generates fewer clicks but more booked jobs can beat a branch with better surface metrics.
Example three with a vet or med spa
A vet clinic may see strong response on pet photos and team stories. Those posts keep the account warm, but reminders about vaccinations, dental cleanings, and urgent care usually produce more direct action. A med spa often sees a different pattern. Educational treatment posts, pricing clarity, and before-and-after context tend to pull more qualified inquiries than polished lifestyle content.
The benchmark should match the job of the post. Awareness content should earn reach, profile visits, and follower growth from the right local audience. Conversion content should earn clicks, consultation requests, calls, and a measurable lead-to-sale rate. If you track post themes against completed bookings and reviews generated after service, you can see which content fills the calendar and which content merely looks active.
A benchmark matters only when it changes what your team posts, promotes, and measures next.
Turn Twitter Insights Into Growth
Used well, analytics for twitter helps you stop guessing. You can see which posts build attention, which ones earn action, and which content themes support reviews, Google Business Profile performance, and lead handling across one location or many.
The businesses that get the most value from X don't obsess over every metric. They pick a few signals, track them consistently, tag their links, and connect social data to booked work and reputation. That discipline is what turns a social channel into a local growth channel.
Frequently Asked Questions About Twitter Analytics
A service business posts three times a week, sees decent reach, and still cannot answer a simple question from the owner: did any of this produce calls, estimate requests, reviews, or booked work? That is where Twitter analytics becomes useful. The right answers are the ones that connect post performance to local business outcomes, not vanity numbers.
Quick answers operators actually ask
| Question | Answer |
|---|---|
| What is the most important Twitter metric for a local business? | The best starting metric is engagement rate, because it shows whether people did anything with the post after seeing it. On its own, though, it is not enough. Pair it with link clicks, reply quality, and conversion actions such as form fills, calls, or review visits. |
| Are impressions enough to judge performance? | No. Impressions show distribution. Service businesses need to know whether that attention led to site visits, direction requests, review prompts, or actual leads. |
| Should every location in a multi-location brand use the same KPI targets? | Use the same scorecard, but set targets by market reality. One location may get more branded searches, another may depend more on promotions, and a third may have stronger review velocity that improves conversion after the click. |
| How often should I check analytics for twitter? | Review headline metrics weekly. Do a monthly review that compares content themes, campaign tags, and lead quality. Check more often only during promotions, service issues, or active reputation problems. |
| Can Twitter analytics help with local SEO? | Yes, indirectly. Better post engagement can drive more branded searches, more visits to location pages, and more review opportunities. Those signals support Google Business Profile performance, even though Twitter activity does not replace local SEO work. |
| What should I do if I spot negative mentions? | Treat them as customer service data. Respond promptly, move sensitive details to a private channel, and log the issue by location or service line so operations can fix the root problem. |
| Do I need a third-party tool? | Native analytics works for basic tracking. Add outside reporting only when you need historical storage, easier exports, cleaner attribution, or side by side reporting across multiple locations. |
A few practical details
How long should I keep Twitter data?
Keep it longer than the platform makes convenient. Export performance reports on a regular schedule and store them by month, campaign, and location. That archive helps you compare seasonality, see whether a promotion affected review generation, and spot whether traffic from Twitter produced leads that later turned into sales.
What's a good way to handle negative feedback found through analytics?
Treat it like a service recovery process.
- Acknowledge the issue clearly
- Move private details off the public thread
- Notify the right manager or location lead
- Track repeat complaints by service type or branch
- Update scripts, staffing, or follow-up steps if patterns keep showing up
A complaint trend on Twitter often shows up somewhere else too. Lower review ratings, weaker close rates, and more missed calls tend to follow unresolved service problems.
Can Twitter help with "near me" searches?
It can support them indirectly. Posts that mention real services, neighborhoods, and city names can increase brand familiarity before someone searches Google for your category or your business name. For local companies, that matters because branded search and trust often influence who gets the click and who gets the call.
Should healthcare practices answer every public comment?
They should answer carefully, not automatically. Thank people for positive feedback, acknowledge concerns in general terms, and move anything tied to treatment, billing, or personal health information into a secure channel. The goal is to protect privacy while still showing that the practice responds.
What should I track if my goal is more reviews, not more followers?
Track posts that send people to the pages that matter. That usually means review request links, location pages, booking pages, and service pages with clear next steps. If those clicks rise but reviews do not, the issue is usually the handoff. The ask may be weak, the landing page may be confusing, or staff may not be reinforcing the request after the visit.
The best Twitter analytics habit is simple. Track a small set of metrics and tie each one to revenue, reputation, or retention.
If you want help turning social signals into stronger reviews, cleaner local visibility, and more measurable lead flow, Reviews To The Top can help. We offer month-to-month support for local and multi-location businesses that want a disciplined review and reputation program without adding more work to the front line. If that sounds useful, you can explore your options and book a strategy call from the site.