If you're posting on X and wondering whether any of it leads to calls, messages, appointments, or walk-ins, analytics on twitter is how you stop guessing. The useful part isn't seeing that a post got attention. It's learning which posts moved people closer to booking, visiting your profile, clicking your site, or searching your brand in [City].
For a local business, that matters because social activity can support both direct conversion and local search visibility. A stronger brand presence helps with prominence, one of the signals Google weighs alongside proximity and relevance when deciding who shows up for searches like “dentist near me” or “HVAC repair near me.”
Why Twitter Analytics Matter for Your Local Business
A practice manager reviews the month’s marketing and sees the usual social report: impressions, likes, follower growth. The obvious question comes next. Did any of that lead to calls, appointment requests, or more people recognizing the business name when they were ready to book?
That is the fundamental role of analytics on twitter. It helps you separate activity from business impact. For a local service business, the useful signals are the ones that show intent building in your market: profile visits, link clicks, replies, branded searches, and public conversations that shape reputation before someone chooses a provider.

Key Facts
According to Sprout Social’s X statistics roundup:
- X has a potential ad reach of 557 million users globally and 251 million daily active users. For a local business, the point is not worldwide exposure. It is that enough people still use the platform for it to influence local brand discovery, especially in competitive U.S. metro areas.
- X ranks as the 15th most popular social network worldwide, and the platform’s top country by usage is the United States. That makes it more relevant for U.S. service businesses than many owners assume, particularly if patients or customers check social profiles before calling.
- 62.9% of users identify as male, and the largest audience segment is men ages 25 to 34. That audience mix can fit categories like auto repair, home services, sports medicine, or certain trades. If that is your buyer, analytics can show whether your posts are pulling in profile visits and site clicks from that audience.
- Gen Z usage is growing 30% faster than Instagram on X. For a local restaurant in a college area, a gym near campus, or an auto shop targeting first-time car owners, that creates a practical opportunity to promote timely offers and watch whether they turn into bookings or walk-ins.
- Average impressions per post declined from 2,864.78 in 2024 to 2,711.29 in 2025, while average interactions rose to 32.89 likes, 6.67 retweets, and 2.56 replies per post. That trade-off matters locally. Lower reach with stronger interaction can still produce better results if the people engaging are nearby and more likely to call.
What local operators usually get wrong
Owners and front desk teams often treat X as a visibility channel only. That leads to reports full of reach metrics with no connection to revenue.
A better read is simpler. Which posts got local people to take a next step? A dental office in [Neighborhood], a vet in [City], or a med spa trying to win more “near me” demand should care less about raw attention and more about actions that suggest intent: profile visits, replies, link clicks, mention volume, and branded search lift.
Practical rule: A post that gets attention without next-step behavior is usually awareness content. Awareness has value, but it should not be mistaken for demand generation.
How this connects to local SEO and AIO
Google’s local model is usually summarized as proximity, relevance, and prominence.
- Proximity is how close the searcher is to your location.
- Relevance is how well your business profile and site match the search.
- Prominence is how established and visible your brand appears online.
X has no control over proximity. It can support relevance when your posts consistently match the services and locations you want to be known for. It can also strengthen prominence when people mention your business, engage with your updates, and search your brand name after seeing your content.
That connection is important because local customers rarely move in a straight line. They might see a post about emergency appointments, check your profile, read reviews, search your name on Google, then call two days later. If you only track likes, you miss the part that affects revenue and reputation.
If you need a quick primer on exposure itself, this explanation of what impressions on Twitter mean for your business is useful. The stronger approach is to treat impressions as the starting point, then track which posts help generate calls, bookings, and real local demand.
Where to Find and Access Your Twitter Analytics
The fastest way to get usable data is to start with the native dashboard. Most busy teams don’t need a complicated setup on day one. They need a repeatable place to check what’s working.

Native dashboard access
According to Popsters’ overview of Twitter analytics tools and metrics, Twitter Analytics is available through desktop dashboards, and Premium accounts can also view analytics in mobile apps. The platform reports account-wide and post-level data such as impressions, engagements, profile visits, link clicks, follower growth, and engagement rates, plus a rolling 28-day summary of tweets, impressions, followers, mentions, and linking tweets.
Use this simple workflow:
- Log into your X account on desktop
- Open your analytics dashboard
- Review the account summary first
- Open individual posts to inspect post-level performance
- Export data as CSV if you want deeper analysis
CSV stands for Comma-Separated Values. It’s a plain file format you can open in Excel or Google Sheets so you can sort posts by date, post type, link clicks, or engagement rate.
What to look at first
Most local operators should ignore the temptation to click everywhere. Start with these areas:
Account overview
Use this to spot broad trends across the recent reporting window.Post-level analytics
It shows which tweet drove profile visits, replies, or link clicks.Audience insights
This matters when your service has a narrow local buyer. A senior living operator and an auto shop shouldn’t use the same tone or content mix.Video performance
Short-form video is currently the top content format on the platform in the Popsters source above, so if you’re posting video, review it separately.
A visual walkthrough helps if your team hasn’t opened the dashboard before:
When native analytics is enough and when it isn’t
Native analytics is fine for a single-location business that posts regularly and only needs basic reporting. It’s less convenient when you manage several locations, compare regions, or need competitor benchmarking.
Third-party tools are useful for different reasons:
| Tool | Best use | Why a local operator might care |
|---|---|---|
| Keyhole | Follower changes and timing | Useful if you want simpler trend views and posting-time guidance |
| Popsters | Top posts and audience patterns | Helpful for comparing content formats and mentions |
| Tweet Binder | Hashtag tracking | Better for events, campaigns, or larger promotions |
A dental group with offices in [City] and [Neighborhood] often needs one report that shows which content themes worked across locations. Pulling that manually from the native dashboard is possible, but slow.
Use native analytics to learn. Use outside tools when reporting starts taking more time than acting on the data.
If you want more context around platform-specific tracking, this collection of Twitter analytics resources is a good next step.
Decoding Key Metrics for Local Service Providers
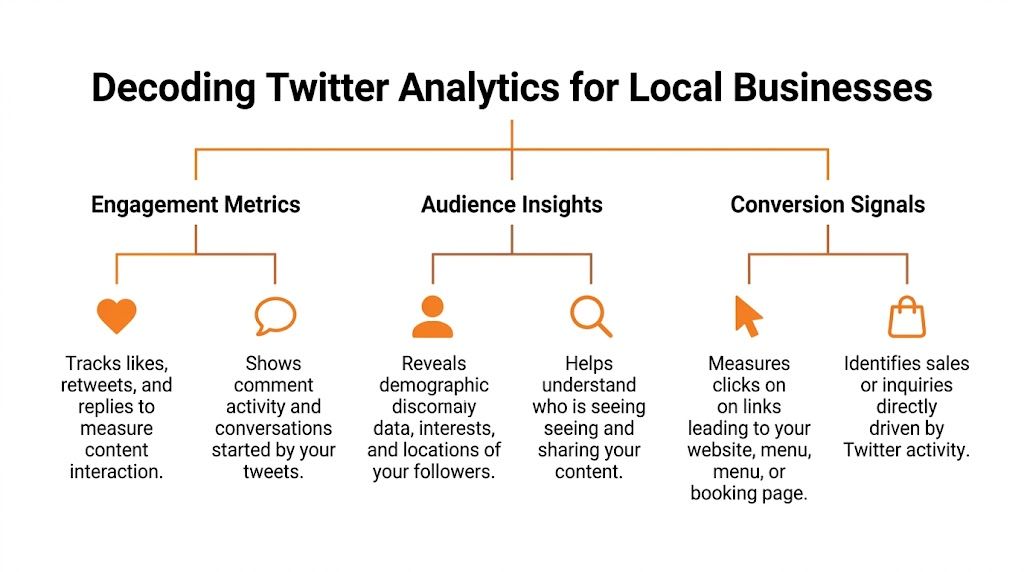
Most dashboards overwhelm people because they put every metric on the same level. They aren’t equal. Some numbers tell you about visibility. Others hint at intent. A few help you improve conversions.
Impressions and engagements
Think of impressions like cars passing your storefront. People saw the sign. That doesn’t mean they stopped.
Engagements are closer to the people who slowed down, looked, asked a question, or shared what they saw. Likes are the lightest interaction. Replies usually tell you more because they require effort.
For local businesses, impressions matter most when paired with the next layer of action. A plumbing company in [City] can get broad reach from storm-related posts, but if nobody clicks or visits the profile, the post probably built awareness more than demand.
Engagement rate
This is the first metric I’d treat as a quality filter. According to Tweet Archivist’s best practices for Twitter analytics, engagement rate is calculated as (Likes + Retweets + Replies + Clicks) / Impressions × 100, and 1% to 3% is a common benchmark range for many accounts.
That same source notes two practical rules that matter a lot:
- You need at least 30 data points before trusting a pattern
- Differences under 10% can be noise rather than something worth changing
That protects you from overreacting to one unusually strong post or one weak one.
Don’t rebuild your content strategy around a sample that’s too small. In local marketing, consistency beats dramatic weekly pivots.
Profile visits and link clicks
These two metrics are where local intent starts to show.
A profile visit means the post made someone curious enough to check who you are. For a med spa, vet, or HVAC company, that often means they’re validating trust before taking a next step.
A link click is more direct. It suggests the person wanted your menu, booking page, financing page, offer details, or service page. Tweet Archivist notes that stronger engagement rates correlate with more profile visits and more link clicks, and that tagged links let you attribute that traffic later.
Follower growth and audience insights
Follower growth matters less as a vanity number and more as a signal of whether the right content is building a durable audience. If your educational posts keep bringing in followers while your discount posts don’t, that tells you something useful about trust.
Audience insights help you avoid generic posting. If your followers skew toward a certain location, interest category, or demographic profile, your content should reflect that.
For example:
HVAC company
Home maintenance reminders, weather-triggered tips, financing questionsDental office
Insurance timing, family scheduling, hygiene education, new-patient reassuranceAuto repair shop
Safety checks, seasonal maintenance, warning-light education, local road-trip prep
What to compare and what to ignore
Period-over-period comparison is more useful than isolated snapshots. Compare this month to last month. Compare the same season year over year if you have the data available.
A short reference point helps:
| Metric | What it usually tells you | Local takeaway |
|---|---|---|
| Impressions | Reach | Did enough people see the message? |
| Engagement rate | Content quality | Did the post resonate? |
| Profile visits | Brand interest | Did people want to learn more? |
| Link clicks | Action intent | Did they move toward booking or inquiry? |
| Replies | Conversation quality | Did the post surface real customer questions? |
If your team needs a stronger reporting structure across channels, this guide to local SEO reporting can help tie social data into broader local performance.
Turning Twitter Insights into More Local Customers
Raw data doesn’t help the front desk, the service advisor, or the regional marketing lead. Decisions do. The best use of analytics on twitter is to turn patterns into a tighter content plan, better timing, cleaner campaigns, and faster reputation response.

Use top tweets to choose what to repeat
The easiest win is to stop treating every post idea as equal. According to Birdeye’s guide to Twitter analytics, top tweet analysis breaks performance down by impressions, engagements, and engagement rate. That helps you identify formats and topics worth repeating.
The same source reports that:
- Videos can achieve 2x higher view rates
- Top tweets often generate 3x to 5x more profile visits and follower growth than average posts
- Detail expands can lead to follows at 1% to 2% of impressions
- Live video streams and Spaces can deliver 40% higher retention when posted at peak times
- Impressions often peak 20% to 30% during 8 to 10 AM and 6 to 9 PM
- A/B testing hashtags can correlate to 15% lifts in impressions
- Top tweets can drive 10% to 15% of total conversions for hospitality venues
That doesn’t mean every local business should chase video all day. It means you should inspect your own winners first, then test close variations.
For a local business, “repeat what worked” often looks like this:
Dental office
Educational carousel about common questions before a first visitAuto shop
Short video showing brake warning signs or tire wearSenior living community
Resident lifestyle content paired with a simple next stepRestaurant
Short-form video featuring a dish, event night, or staff moment
Adjust timing and frequency based on behavior
If your audience responds in the evening, posting service updates at mid-morning may be a mismatch. If replies spike on weekdays but offers underperform on weekends, you should split education and promotion instead of pushing everything on one schedule.
Historical review proves more valuable than hunches. If you need cleaner, trackable links in posts and profiles, a practical resource is this guide on how to create custom URLs for Twitter. Branded, readable links are easier to test and easier for customers to trust.
Good timing won’t rescue weak content. Strong content posted at the wrong time still underperforms.
A workable operating rhythm for many local teams is simple:
- educational posts when people are likely to browse
- promotional posts when they’re more likely to act
- reply monitoring throughout the day so mentions don’t sit unanswered
If you want a broader posting cadence benchmark, this article on the best day for social media posts is useful as a starting point. Your own account data should still override generic advice.
Feed your local search presence
X activity doesn’t replace Google Business Profile. It supports the ecosystem around it.
If a post drives somebody to search your brand name, click your profile, read reviews, and call the office, social assisted the conversion. That’s one reason active social can support Google’s prominence signal over time.
Keep your Google Business Profile tight so the traffic you generate converts:
- Primary category correct so Google understands your core service
- Hours accurate including holiday changes
- Service list complete for high-intent terms
- Location data consistent across web listings
- Photos current so profile visitors trust what they see
- Reviews answered quickly and professionally
Use mentions as a reputation and lead source
Mentions are underrated. They surface praise, complaints, product questions, location confusion, and operational friction.
A vet clinic might catch a post from someone asking whether same-day appointments are available. An auto shop might spot a complaint about wait time. A med spa might find a prospective client asking about consultation steps.
Those moments matter because they’re public. A fast, useful answer doesn’t just help one customer. It shows everyone else how your team handles issues.
Practical Templates and Checklists for Local Growth
A busy practice manager does not need another social media worksheet that ends with “post more.” You need a repeatable way to use analytics on twitter to find which posts lead local people to call, book, ask questions, or show up with your brand already in mind.
The easiest way to keep Twitter activity tied to local growth is to review the same few things every week, then make one or two clear changes.
Weekly top tweet analysis template
Use this once a week. Pull your top 3 tweets by engagement or link clicks, then judge them by business intent, not by likes alone.
Template
- Tweet date:
- Tweet format: text, image, video, reply, thread
- Topic: promotion, FAQ, local event, staff highlight, service education, urgent update
- Target area: city, neighborhood, service area
- Impressions:
- Engagement rate:
- Link clicks:
- Profile visits:
- Replies or DMs generated:
- Did it mention a service, location, or next step clearly? yes or no
- Did it create local customer intent? low, medium, high
- What likely made it work or fail?
- What will you test next week?
Quick example
- Tweet format: image
- Topic: same-day dental emergency slots
- Target area: West Houston
- Result: strong clicks, low likes
- Business read: good post, because appointment intent beat public engagement
That last line matters. For local service providers, a tweet with modest engagement can still be a strong performer if it drives booking behavior.
Monthly Twitter analytics report for a local business
Use one page. If the report takes 20 minutes to read, nobody will use it.
Month:
Location or service line:
Primary goal: calls, consults, bookings, walk-ins, branded searches
1. Best-performing content
- Top tweet by link clicks:
- Top tweet by engagement rate:
- Top tweet by profile visits:
- Top tweet by replies or DMs:
- Common trait across winners:
2. Underperformers
- Lowest click-through post:
- Post with high impressions but weak action:
- Topic or format to reduce next month:
3. Local intent signals
- Tweets mentioning city or neighborhood:
- Tweets mentioning specific services:
- Tweets with clear call to action:
- Tweets that triggered customer questions:
4. Traffic follow-through
- Website visits from X:
- Booking page visits from X:
- Contact page visits from X:
- Calls or form leads that can be tied back to tagged links:
For teams that need a cleaner setup, this guide on tracking website visitors from social traffic helps connect post clicks to actual site behavior.
5. Actions for next month
- Keep:
- Stop:
- Test:
- Assign owner:
- Review date:
If you report on analytics on twitter this way, the conversation changes. Staff stop arguing about reach and start asking which topics create intent.
A/B testing checklist for local tweets
Do one test at a time. If you change everything at once, the result is useless.
Test these variables:
- Service-first opening vs location-first opening
- Text-only vs photo
- One clear CTA vs informational post
- “Call now” vs “Book online”
- Staff photo vs before-and-after image
- Morning vs late afternoon posting time
- Short post vs slightly longer explanatory post
For each test, check:
- Did one version get more link clicks?
- Did one version get more profile visits from local users?
- Did one version create more replies with buying intent?
- Did one version send more traffic to high-intent pages such as contact, booking, pricing, or directions?
A med spa may find that treatment education gets more likes, while limited-slot consultation tweets get more booking clicks. An auto shop may see the opposite during seasonal service periods. The trade-off is normal. Attention and action are not the same thing.
10-minute weekly checklist
- Export or review your last 7 days of analytics on twitter
- Mark your top 3 tweets by clicks, not just impressions
- Check whether winning posts mentioned a local area or specific service
- Review replies and DMs for customer questions you can turn into future posts
- Compare post formats, text, image, video, reply, or thread
- Check which links sent people to booking, contact, or service pages
- Flag one weak post and write a better version to retest
- Save screenshots of standout posts for your monthly report
- Share one clear takeaway with the person handling phones or front desk
- Decide the next test before the week gets busy
Practical content prompts based on analytics
If your numbers show high impressions but weak clicks, write more direct service offers.
If profile visits are rising but bookings are flat, tighten your bio, pinned post, and landing page path.
If replies are strong on operational posts, publish more content around wait times, availability, insurance, parking, service areas, or appointment prep. Those topics often convert because they remove friction.
If you need a simple way to frame results for ownership, this article on how to measure marketing campaign success is a useful reference for turning channel data into decision-making.
Good local Twitter reporting is plain and disciplined. Track what people clicked, what they asked, what page they reached, and what happened next. That is how analytics on twitter becomes a tool for local growth instead of a stack of screenshots.
Measuring Real Business Impact and ROI from Twitter
The biggest trap in analytics on twitter is assuming visible activity equals business value. It often doesn’t. A post can perform well on-platform and still produce very little for the business.
That gap is well described in this analysis of why X metrics can be misleading for ROI, which points out that native analytics emphasizes counts like impressions and engagement while failing to connect those numbers to local conversions. It also notes three limitations that matter for multi-location brands: X may not show which specific accounts engaged, it can create attribution blind spots across locations, and it deletes data after 1 year.
Use UTM tags like breadcrumbs
UTM stands for Urchin Tracking Module. In plain English, a UTM is extra text added to a URL so analytics software can tell where a visit came from.
For example, if you post a booking link on X, tag it so your analytics can distinguish:
- organic X traffic
- a specific campaign
- one location versus another
- one post theme versus another
A simple structure looks like this in practice:
- source = x
- medium = social
- campaign = spring_ac_check
- content = video_post or text_post
- location = city_north or downtown
That way, when someone books a service after clicking, you can trace the visit back to the post type and location campaign.
What to measure beyond X itself
Local operators need a measurement stack, not one dashboard. Track social metrics, but connect them to business outcomes.
Recommended operating targets:
Review volume
Aim for a steady monthly increase by location. The exact number depends on traffic and customer volume.Review recency
Don’t let locations go stale. Fresh reviews influence buyer trust.Response time
Reply quickly, ideally within a day, especially for negative feedback.Star rating
Maintain a strong average rating and watch for location-level slippage.Google Business Profile views and calls
Watch whether social campaigns correlate with increased branded search activity and profile actions.Lead-to-sale conversion
Don’t stop at leads. Track whether leads from social-assisted traffic turn into appointments, tours, or jobs sold.
If you want a broader framework, this piece on how to measure marketing campaign success is a useful companion because it keeps the focus on outcomes, not just channel activity.
A practical reporting view for local teams
A useful monthly scorecard usually includes:
| Layer | What to track | Why it matters |
|---|---|---|
| Platform | Engagement rate, profile visits, link clicks | Shows content quality and interest |
| Local search | GBP calls, directions, bookings | Shows whether demand is moving locally |
| Reputation | New reviews, average rating, response speed | Shows trust and conversion readiness |
| Sales | Leads, appointments, close rate | Shows actual business impact |
One more operational point matters. Native X analytics won’t fully solve multi-location attribution. That’s why many teams use tagged links, call tracking, and centralized reporting together.
If you need a practical starting point, this guide on how to track visitors to a website helps connect social traffic to site behavior more clearly.
Frequently Asked Questions About Twitter Analytics
Why do my analytics numbers look different from what I see on my profile
Public counts and the analytics dashboard often refresh on different schedules. Give it a little time, then compare again before treating the gap as a reporting problem.
Can I see analytics for another business account
You can only access detailed analytics for an account you own or manage. For competitors, use public signals such as posting frequency, replies, follower growth, and which topics get visible engagement. That is enough to benchmark content direction, but not enough to judge whether their posts are producing calls or booked jobs.
What audience data can I actually use
Use audience data at the aggregate level. It is useful for choosing topics, posting times, and offers that match local demand.
For a service business, the practical question is simple. Does this audience respond to messages that lead to inquiries, quote requests, or appointment intent?
How far back should I look before changing strategy
Review a large enough sample to spot repeat patterns. In practice, that usually means comparing several weeks or a full month of posting, then checking whether the same themes keep driving profile visits, site clicks, and branded search activity. One strong post is helpful. A repeatable pattern is what justifies a content change.
Should I optimize for impressions or engagement rate
Start with engagement quality, then check for action. A post with lower reach but more profile visits, link clicks, replies from local prospects, or call intent is usually worth more than a post that gets seen widely and does nothing for the business.
This matters a lot for local teams because attention without follow-through rarely turns into appointments.
How does this help with near me searches
Twitter analytics will not show you map rankings. What it can show is whether your content is creating local awareness and trust that later shows up in branded searches, review activity, direct traffic, and inquiries. For a clinic, agency, law firm, or home service company, that connection is the point. Social activity supports reputation and recall, which often influences who gets the call when someone is ready to book.
What should a healthcare practice avoid
Keep patient details out of public replies. Do not confirm treatment, timing, or any other protected information. A safe approach is to acknowledge the concern briefly, invite the person to contact the office directly, and handle the issue offline.
The same standard applies to dental practices, med spas, therapists, and any team handling sensitive customer information.
What if my team does not have time to implement this consistently
That is common, especially in smaller practices and multi-location service businesses where the front desk, operations team, and owner are already stretched. In that case, get outside help that ties Twitter reporting to the metrics that matter locally, such as calls, form fills, reviews, bookings, and Google Business Profile actions, instead of handing over a report full of impressions. If that would help, get hands-on help connecting reviews, local listings, and reporting so the work stays focused on customer acquisition and reputation, not platform busywork.